


Article
What Metrics Should I Use To Measure Success?
You spend a boatload of money on your website, but how do you know it’s successful?...

Apr 03, 201512 min Read
Continue Reading
If your idea of website tracking is monitoring your users, sessions, and bounce rate once a month in your Google Analytics report, then you’re no better than the person who shows up to a book club discussion having only read the back cover.
Knowing your basic user trends is incredibly useful, but if that’s all you’re getting out of your reports, then you’re missing out on a ton of cutting-edge tools and juicy data that could provide the actionable insights you need to supercharge your website and marketing efforts.
For starters, the 8 metrics we’re going to discuss are all incredibly easy to set up and most are 100% free. While that should be reason enough alone, here’s even more incentive to pay attention.
Having the right data can help you:
Convinced yet? Good. Now here are the 8 conversion and engagement points every business MUST be tracking in 2020.
1. Goals/Conversions2. Call Tracking3. Scroll Depth4. Internal Search Terms5. Demographics6. Funnels7. Attribution8. Element Clicks |
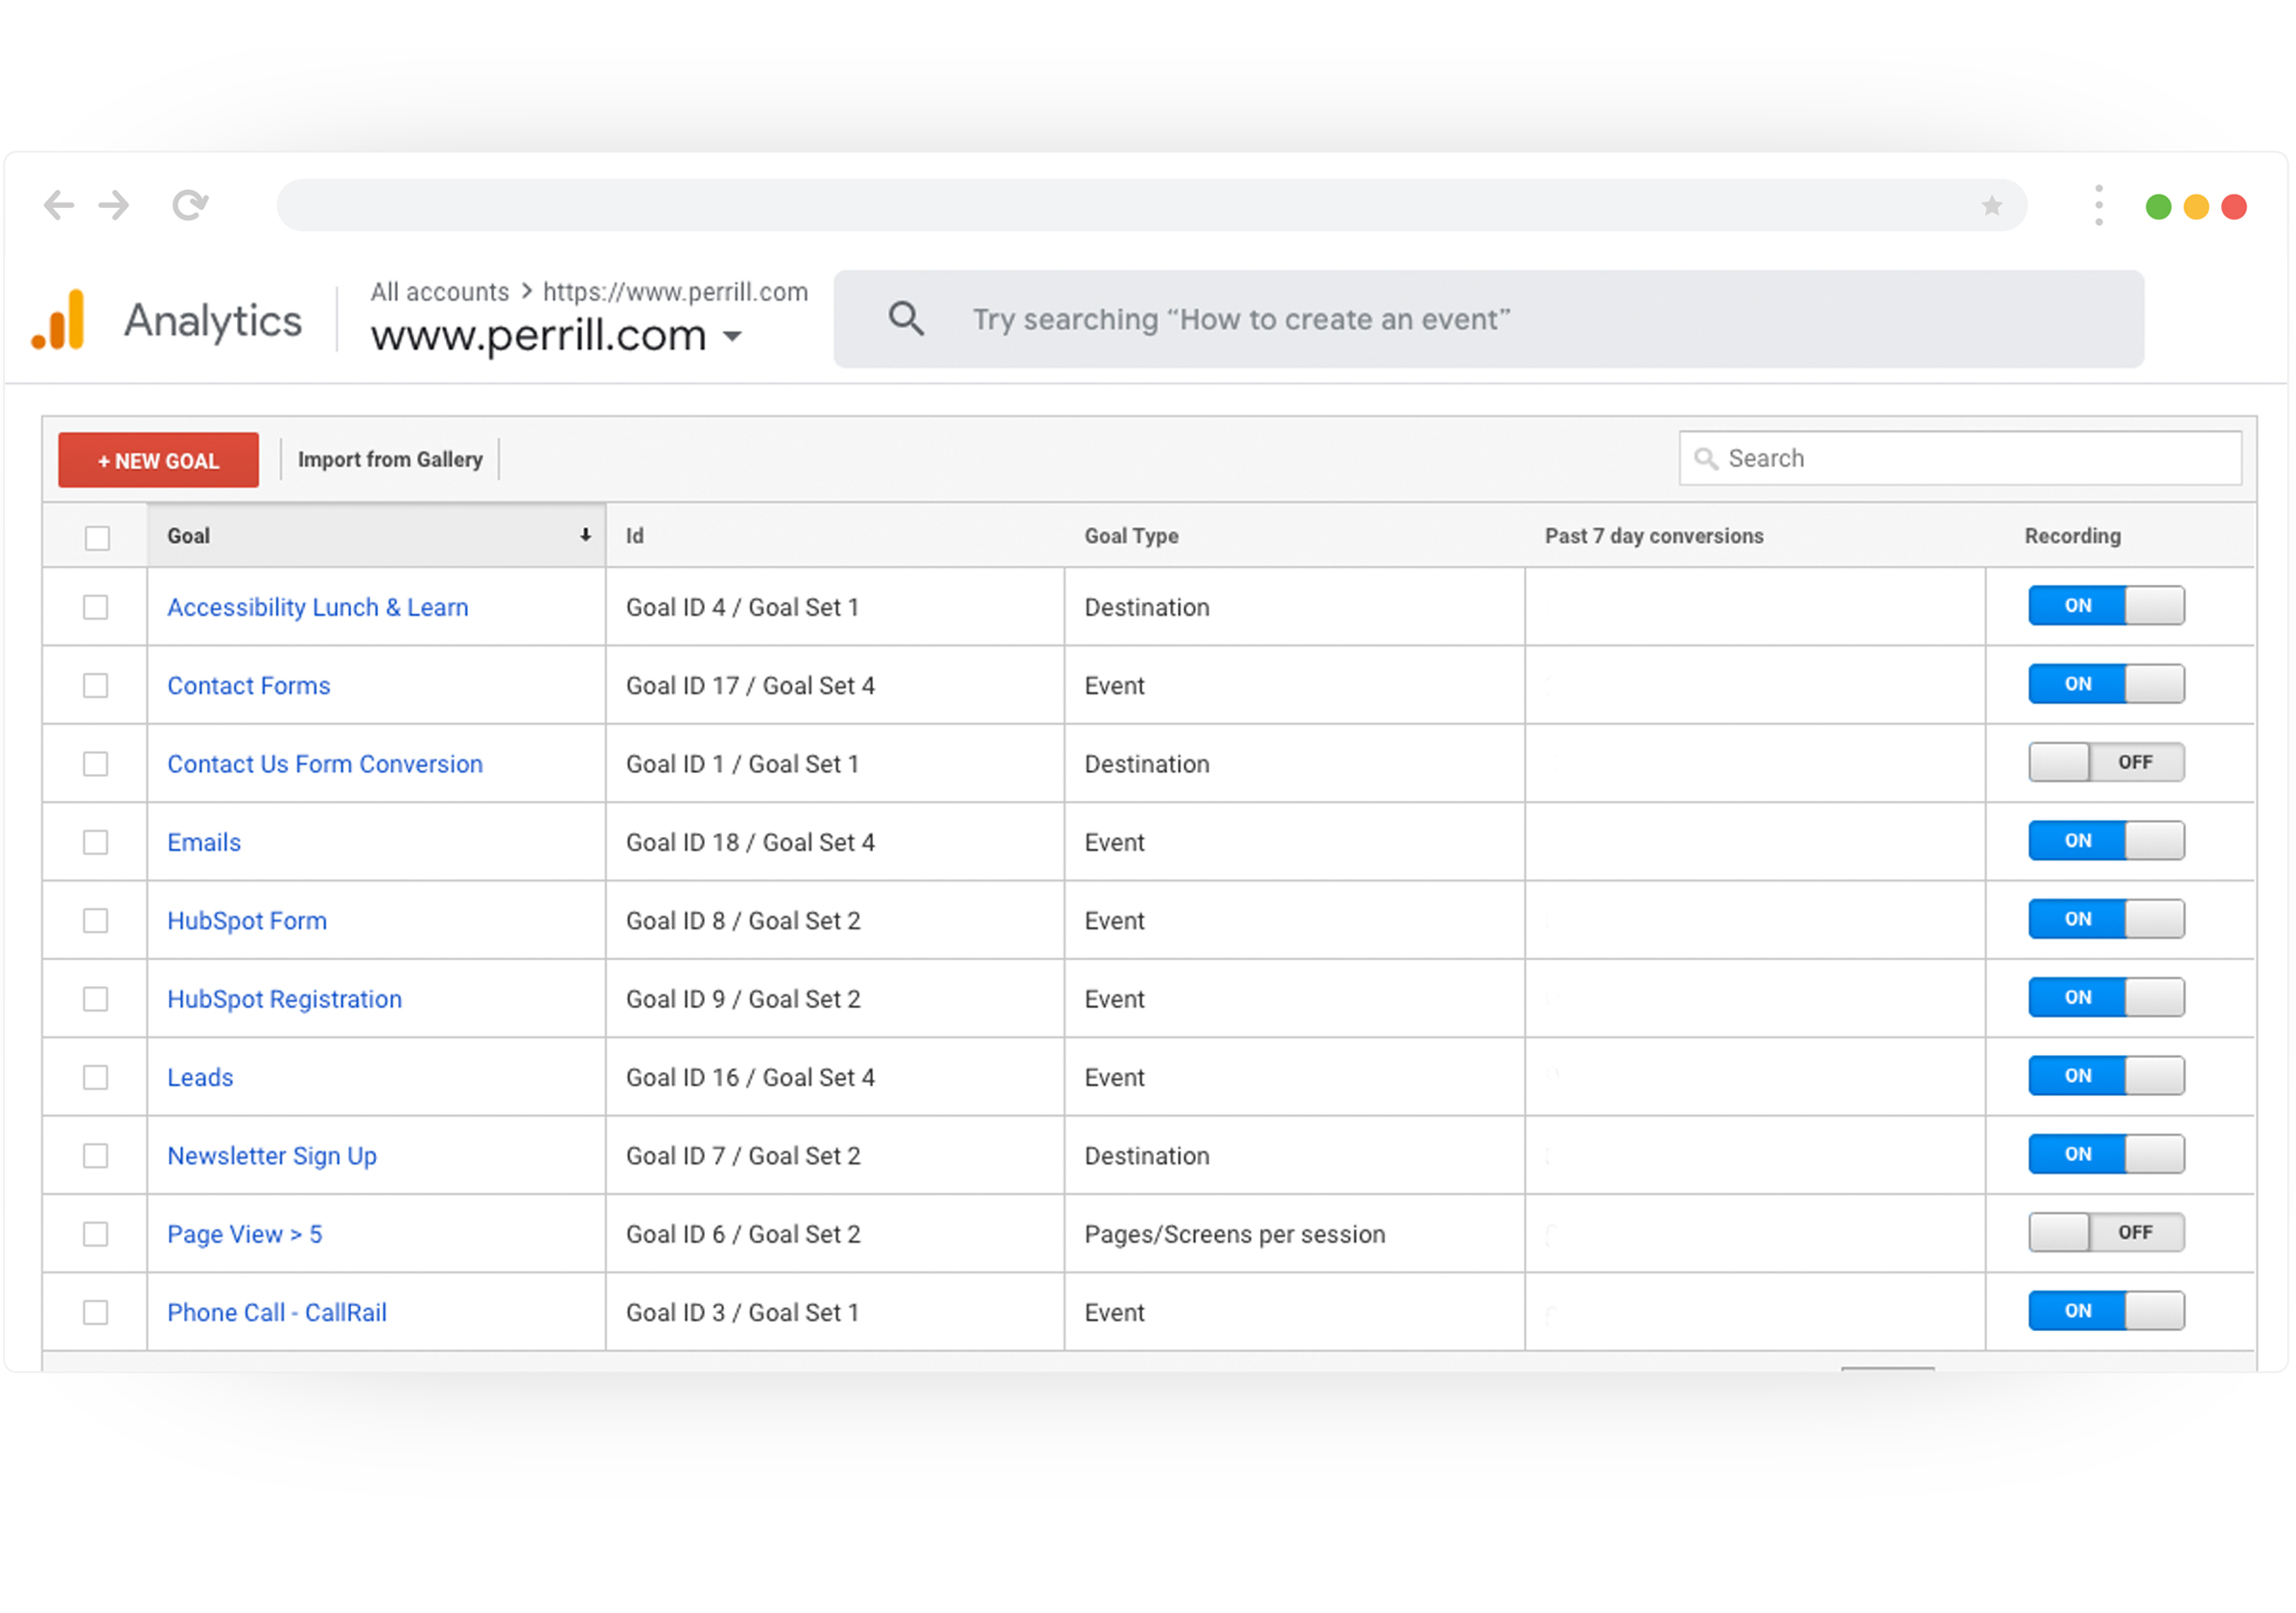
The first (and arguably most important) thing you need to do is get a set of analytics goals in place, because without them, your business will have nothing to aim for.
When setting up your goals, focus on your most important conversion points. In other words, what do you want people to actually do on your website?
This could be any number of things, from filling out your contact form or signing up for your newsletter to contacting your business via an email or phone call.
Try to avoid setting softer goals such as a page view count, unless it’s really a driver of your business. Focus instead on true conversions that make you money.
Just don’t be afraid to set the bar high, as goals are not always meant to be reached.
As Michelangelo—the renaissance artist and master of everything he touched—once said, “The great danger for most of us lies not in setting our aim too high and falling short; but in setting our aim too low and achieving our mark.”
Utilizing a good call tracking service is one of the rare analytics tools on this list that will cost you money, but is absolutely worth the price of admission.
Call tracking lets you know not only how many phone calls you’re getting each month, but exactly which channels or campaigns generated them. It’s always great to get a bunch of calls, but it’s even better knowing that they came as a result of your paid ads, website referrals, or through an organic Google or Bing search.
By tracking calls through your CRM or data studio report, you can better determine which sources are driving your revenue and adjust your marketing dollars accordingly.
We recently enabled call tracking for one of our ecommerce clients. Now, you might be thinking that isn’t necessary for an ecommerce website. However, for this particular client, the vast majority of orders require an initial phone call due to their expensive and complex nature.
Our client already knew how many calls they were getting each month, but had no idea where they were coming from, which was causing major attribution issues.
By setting up call tracking, we determined where each call was coming from so they could readjust their budget (more on Facebook, less on Google, and adding LinkedIn to the mix) to get the most revenue for the least amount of spend.
Simply knowing how many users visit your site each month is not good enough. You need to know how many people are engaging and what exactly they’re seeing.
By setting up scroll depth tracking, you can see how far people are scrolling down on each page of your site (homepage, products, services, blog posts, etc.).
This lets you know what content is getting the most/least eyeballs, if visitors are actually seeing your call to actions (CTAs), and if you need to rearrange your pages to create better engagement points.
Here’s how to do it:
We have a client whose average scroll depth for their website was 43% across all pages. However, we noticed that one page in particular had a 0% scroll depth—which essentially means that no one was scrolling on that page at all.
Of course, we knew there was valuable information on that page, so we made some on-page content adjustments in order to incentivize people to move further down the page and actually see that content—and lo and behold—it worked.
If you don’t know, an internal search is when you use a website’s built-in search bar (usually located in the header) in order to find something within the site. While obviously a helpful feature for your visitors, it can be just as useful to you as an analytic tool. If you don’t already have one, you need to add this feature right away.
With this data, you can:
With one ecommerce client of ours, we noticed that visits that included a site search had a 6.2% conversion rate, as opposed to visits without one that garnered only a 0.5% conversion. This data informed us that our site search was working, is highly effective, and gets people where they need to go.
With site search data enabled, not only will you learn what people are searching for, you’ll know exactly what they do after they search. By making small tweaks to your website, you can make that process much more efficient for the end user and retain their interest longer.
You certainly don’t need me to tell you how useful it is to better understand exactly who is coming to your site. By tracking your user demographics, you can see their age, gender, interests, and much more.
With that data, you can fine-tine your user personas, better target your ad campaigns, and see who’s actually converting.
For example, if you expect the majority of your audience to be 45-year-old females, but when you look at your demographic reports you find that most of them are 25-year-old males, you’ll see there’s a big misalignment between who you think your customer is and who’s actually using your website.
The good news is, if you’re using Google Analytics, demographics tracking is super easy to implement, as all it requires is a click of a button. The problem is, while it’s a built-in feature, it’s turned off by default, meaning a lot of people miss it.
Most other popular analytics tools have options for demographics tracking as well, so it’s worth looking into how to set it up for your particular software.
While it’s important to know your conversion points (ecommerce sales, form completions, appointment requests, etc.), you need to do more than just set them up and forget them. By implementing funnels, you can see when people came into the process and exactly where they’re dropping off.
Speaking of drop-offs, you can use these funnels to address what’s holding up your visitors.
Are there too many pages to go through?
Is the checkout process too complicated?
Are there too many steps in the form?
I recommend setting up your funnels with as much detail as possible. In certain situations, we’ve gone so far as to add steps for every single field on a form (name, address, email, etc.) and every stage of an ecommerce purchase (shipping selections, payment methods, etc.).
Find where your chokepoints are so you can make the process easier for your customers.
One definition you won’t find in the dictionary but is true for anyone who’s ever tried to properly attribute something before: it’s a huge pain in the you know where.
It’s so hard to figure out exactly how we acquired our customers and what channels were used along the way, but that’s just what attribution tracking aims to do.
With multi-channel attribution, you can:
When we look at a basic conversion report, we’re seeing it from only the final touchpoint (i.e. this conversion came from an organic search or a direct visit). That data just isn’t good enough.
What it doesn’t tell you is that three visits ago they came in through a paid ad, or two visits ago they came in through an email. You need to know all those touchpoints so you can prioritize your marketing efforts and figure out what channels to invest in.
At this point in the article, it should come as no surprise that every single element on your website can be tracked through your tag manager.
This includes:
Track everything you can, because you can never have too much data. It’s better to collect a ton of data and never use it than to not collect something and find out later that you need it. Once you have this data, analyze it thoroughly before investing any more time on different elements.
When we rebuilt our current Perrill website, we spent a lot of effort on all-new imagery. We thought we needed more images too, and even built fancy carousels to house them.
The problem was, once we started tracking these elements, it became clear that no one was actually clicking through the slider to the other images. We were planning to spend more time and resources on more images, but when we found out nobody was interested in them, we reallocated our efforts to something else.
We definitely wouldn’t have made that decision without careful tracking and ended up saving a ton of time and resources as a result of our analytics.
It’s not just individual users who are visiting your site—sometimes it’s your competitors and fellow businesses.
There are a few ways you can track this metric and get it into your analytics report:
Knowing what businesses are coming to your website is great information for your sales team to have, because when they see the companies visiting, they can easily reach out and make a phone call.
Spending all day looking at analytics reports shouldn’t have to be your job alone. Even armed with this new information, knowing what to look for and how best to analyze it is an uphill battle.
That’s why you need to partner with an experienced digital agency who knows Google Analytics like the back of their hand and can provide you with the actionable insights you need to improve your website and marketing campaigns.
Perrill is a full-service web design and digital marketing agency that specializes in driving client goals through data-inspired solutions. Contact us today to make the most of your website and start converting users like never before.
