


Article
How to Add Editable Areas to Exported MailChimp Templates
If you’ve tried recently exporting a MailChimp template you’ve been greeted with this alert. It’s...

Aug 15, 20142 min Read
Continue Reading

Update (6.28.22) - Google is sunsetting the existing Universal Analytics platform in July 2023. Click here to learn about Google Analytics 4 and why you should upgrade now.
Analytics can be an extremely useful tool in improving your website’s performance and in determining where you’re connecting with your audience and where you might be missing out on growth opportunities. But to make proper use of this data, you first need to know what you’re looking at. All the analytics reports in the world are useless if you don’t know how to make sense of the numbers and then turn them into actionable improvements. Here’s a breakdown of a few of the more useful Google Analytics metrics and how you can use them to improve your website.
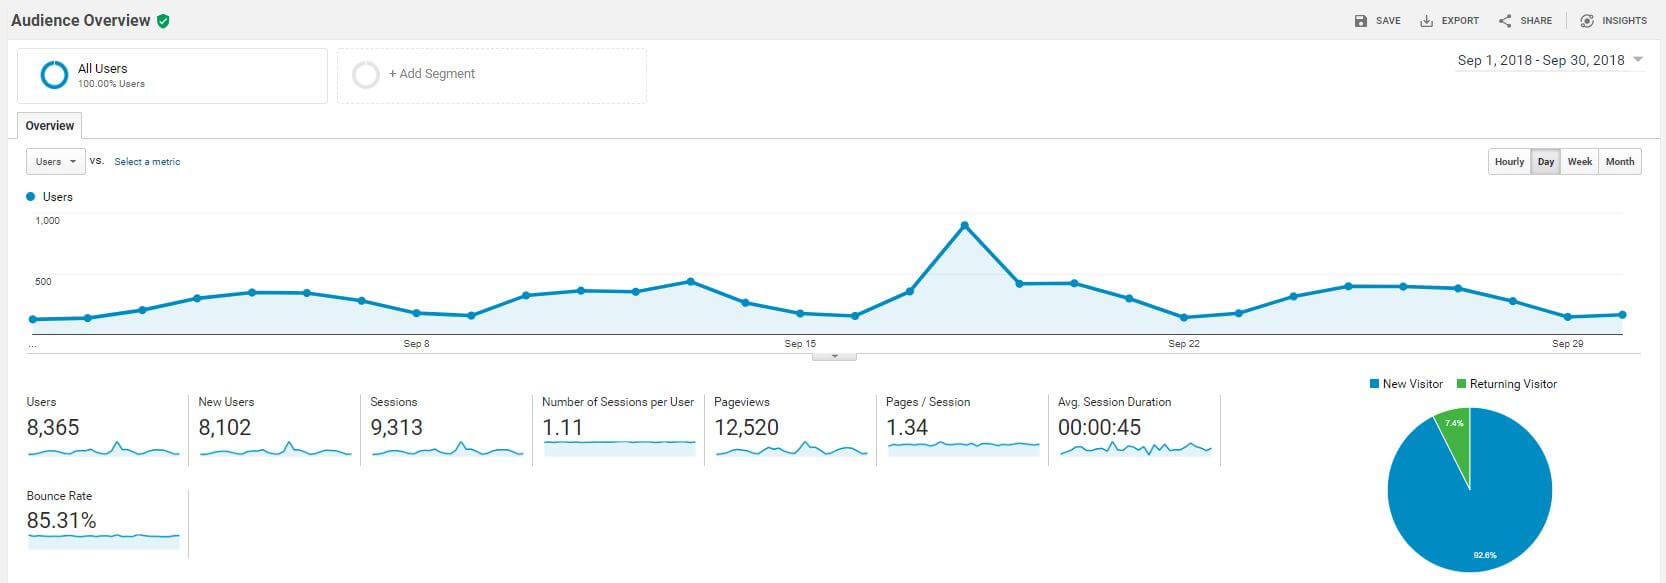
The first report you’re likely to come across is the Audience Overview. In simple terms, this report is a basic look at the traffic to your website. Here’s what each metric means and what you can expect to get out of it:
Users - This is the number of visitors who came to your site during the specified time period. Each person who visits your site within that date range represents one user. Many website owners obsess over the number of users they are getting. More users isn’t always better, but it’s important to watch for any downward trends in your users so you can identify potential problems with your various marketing channels.
New Users - This is the number of new visitors during the reporting date range. In theory, these people have not visited your site before. In reality, some of them probably have but appear to be new users because they have cleared their cookies since their last visit. This is a number you’d like to see grow on a regular basis. If it’s going down, then it probably means you aren’t attracting enough new prospects.
Sessions - This is the number of visits to your website within the date range. Every visit counts as a session. If a user comes to your site, closes their browser, and then returns to your site, this will count as two sessions. By default, a session times out after 30 minutes. If a user leaves their browser open on one of your pages for 30 minutes without interacting with the page, their session will start over when they return.
Number of Sessions per User - This is the average number of times each user visits your website. The closer this number is to 1, the less likely it is for people to come back to your site. A low number of sessions per user is not necessarily a bad thing. If your users are likely to get the information they need in a single session, then you your site could be working just fine. However, if your business thrives on repeat customers, then you’ll want to see a higher number here.
Pageviews - The number of pages that have been viewed during the time range. Every pageview counts. If a user refreshes your contact page 100 times, that will count as 100 pageviews. Knowing how many pages have been viewed on your site isn’t the most helpful metric. There’s not a whole lot you can do with this data other than confirm that people are looking at your content.
Pages / Session - This is the average number of pages a visitor sees per visit. As with sessions per user, it’s not necessarily bad if this number is low. When evaluating this, think of how many pages a user really needs to see before they can convert. If they can fill out a lead form from a landing page, then you don’t necessarily need them to see a lot of pages. More pages per session is not necessarily a good thing. In fact, a high number here could be a sign of a difficult conversion path that’s costing you customers.
Avg. Session Duration - This is one of the least useful metrics you’ll ever see. It’s a measurement of the average of a single session, taken from the first action until the session ends. There are two huge problems with this number. First, by default, all bounces are calculated as zero seconds. So even though a user lands on your site and reads your entire blog post, Google Analytics counts it as nothing. If you have a high bounce rate, this number will be skewed very low. Second, since a session can last up to 30 minutes without activity, a relatively worthless visit could count as a half hour. If you get a lot of these types of sessions, your average session will be artificially inflated. There’s very little value in this number, so don’t spend much time thinking about it.
Bounce Rate - One of the most misunderstood metrics, bounce rate by default in Google Analytics is the percentage of sessions that consist of only one pageview. In other words, a user lands on a page and doesn’t click to go to any other pages. Looking at bounce rate as a whole can be dangerous. It might make you think you have a bad website when the reality is that your users are often accomplishing the entire purpose of their visit in a single page. Don’t judge your website entirely on bounce rate. However, if your homepage bounce rate is very high on mobile but low on desktop, then you might have something to look into.
Other Data - There’s a lot of other data in your basic Audience Overview as well, including language, browser, operating system, location, etc. This information can all be useful, but you probably aren’t going to spend much time looking at this each month. Do you really care what percentage of your traffic is coming from Internet Explorer? Probably not, but your digital agency should. It can help make informed decisions about your website’s effectiveness on different devices and so forth.
While the Audience Overview is all well and good, all it really does is give you a basic snapshot of what’s happening on your website. None of these metrics should be the most important thing you look at each month. Every business wants to see the number of sessions and the number of users constantly rise, but the reality is that every business has its cycles. Maybe your sessions peak on Monday and drop the rest of the week. Maybe no one looks at your website on the weekends. Maybe your traffic hits its high in July and then tails off the rest of the year because you sell seasonal products. These aren’t necessarily bad things. It’s all just data that you can collect, observe, and use to make informed decisions.
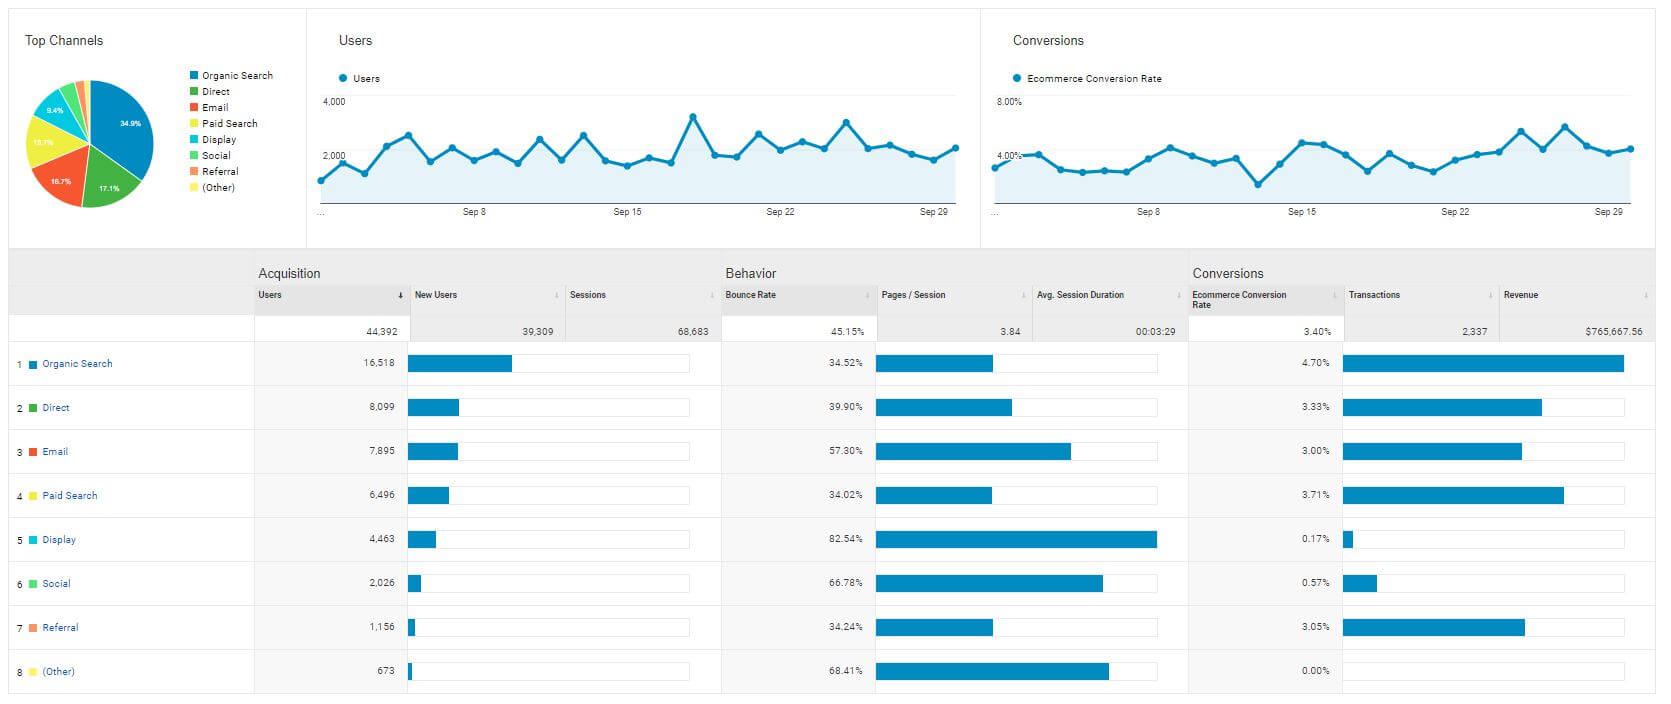
The Acquisition report shows how users are finding your site. This section is typically broken down into these categories:
Organic Search - When people find your site through a search engine like Google, Bing, or AltaVista.
Referral - When users reach your site via a link from another site like Amazon or CNN or doggifpage.com. Note that referral data does not always pass from one site to another.
Social - When users reach your site through a link on a social media channel like Facebook, Twitter, or Pinterest. Note that this only works for channels that are identified as social media by Google. So your proprietary social networking site for jugglers might not fit here, but it might fall under referral instead.
Paid Search - When users reach your site after clicking on a paid search ad. If you are running search ads on Google or Bing, then those visits will all end up in this bucket.
Display - When users reach your site after clicking on a display ad. This only works if your display ad is on the Google Display Network or is properly tagged as a display ad through a known ad network. If you purchase a banner ad directly through your favorite website about dinosaurs on unicycles, those visits will not show up here.
Email - When users come to your site through a link in a properly tagged email. This only works if the links in the email are tagged with email tracking code. If they aren’t, these visits will typically fall into the direct bucket. For example, if you send a friend a normal link to your website from your Hotmail account, the channel will show up as direct. If you want to measure the effectiveness of your emails, you should always use campaign tracking code.
Direct - When there is no other referral source. The most common explanations for this are when someone types your URL into their browser or has your website bookmarked. But there are many other things that can qualify as direct traffic, including traffic that isn’t direct at all.
Other - Any other campaign that doesn’t fit into any of the buckets above. For example, if you’re running a QR code campaign on the scratch-n-sniff postcards you send to your web design prospects, those visits will show up here provided you use proper campaign tracking code.
The Acquisition report also shows the behavior and conversion rate of users based on how they find your site. If you notice that visitors acquired through paid search have a lower conversion rate than those acquired through organic search, you may want to alter your paid search strategy to flip that trend. If almost all of your traffic is coming from organic search, you may want to invest in other channels. If 100% of your social media traffic is bouncing, you may want to rethink how you’re driving people to your site with social. If you have no referral traffic, you may want to identify some opportunities to build links on other domains.
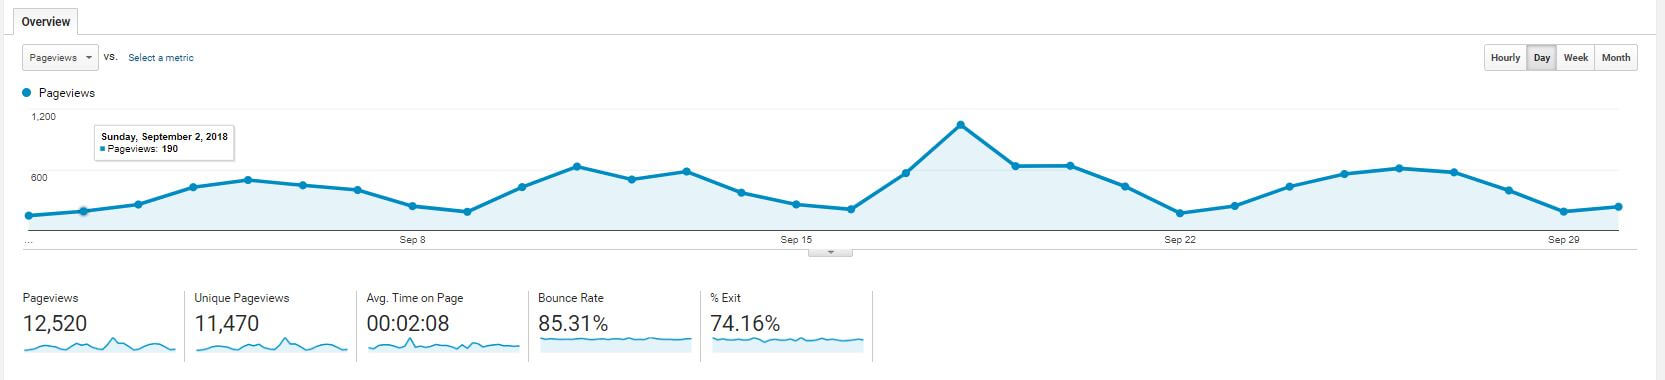
This report features a number of metrics we already explored in the Audience Overview section. In addition to Pageviews and Bounce Rate, this report also shows us:
Unique Pageviews - The total number of pageviews minus any repeat offenders. In other words, if a user looks at the same page twice, it will count as 2 pageviews but only 1 unique pageview.
Avg. Time on page - Similar to Avg. Session Duration, this is a metric you can often ignore. The data can be heavily skewed by single-page visits or sessions that time out. However, it can give you some insight into whether or not people are engaging with your page as much as you would hope, but there are better things you can do to measure this engagement by using event tracking.
% Exit - As with many other metrics, this one is pretty useless when considered from a sitewide viewpoint. It’s calculated by dividing the number of pageviews by the number of exits. It’s pretty obvious, but an exit is when someone leaves your website. Since everyone leaves your website eventually, you might think that the overall exit rate should be 100%. But the purpose of this metric is not for looking at the whole site. It’s for looking at individual pages. If 99% of your exits happen on the checkout page, that’s probably not good for your ecommerce website. But if 75% of your exits occur on the order confirmation page, then you are obviously doing something right.
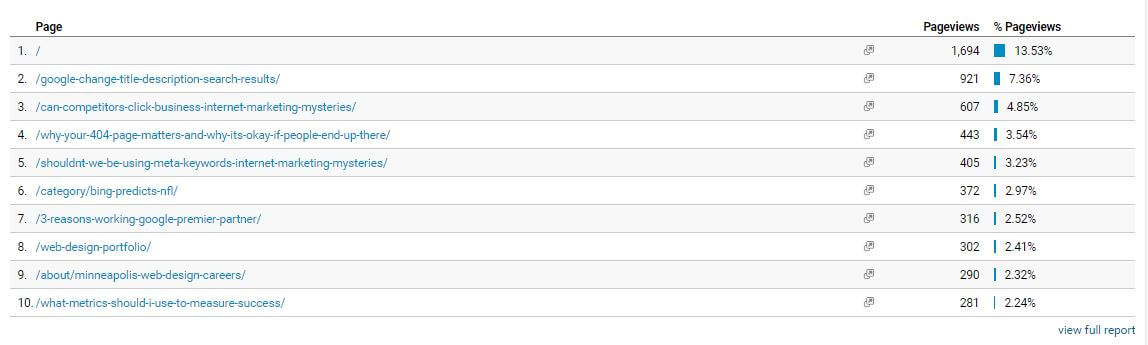
Page report - This report shows you the pageviews and percentage of pageviews for the top URLs on your website. Your homepage is typically identified as just a /, and it is almost always the top page on the report. Ideally, you will see your pageviews spread out across many pages. If 95% of your pageviews are on the homepage, then either your homepage is really engaging or not many people are engaging with the rest of your site.
Finally, we’re getting to the really good stuff. After all, conversions are what matter most. We’ve already seen some conversion data trickle in through some of the other reports above, but this is where it gets detailed.
The two main things you’ll probably look at in regards to conversions are Goals and Ecommerce. Of course, if your site doesn’t sell any products, you can ignore that report.
Let’s examine the Goals Overview first. This report shows you data for all the goals you’ve defined in Google Analytics. If you haven’t defined any goals, then shame on you. If it makes you feel better, the vast majority of new clients we take on have zero goals configured. And when they do have goals configured, they are often set up incorrectly. That shouldn’t make you feel better. It makes me feel terrible.
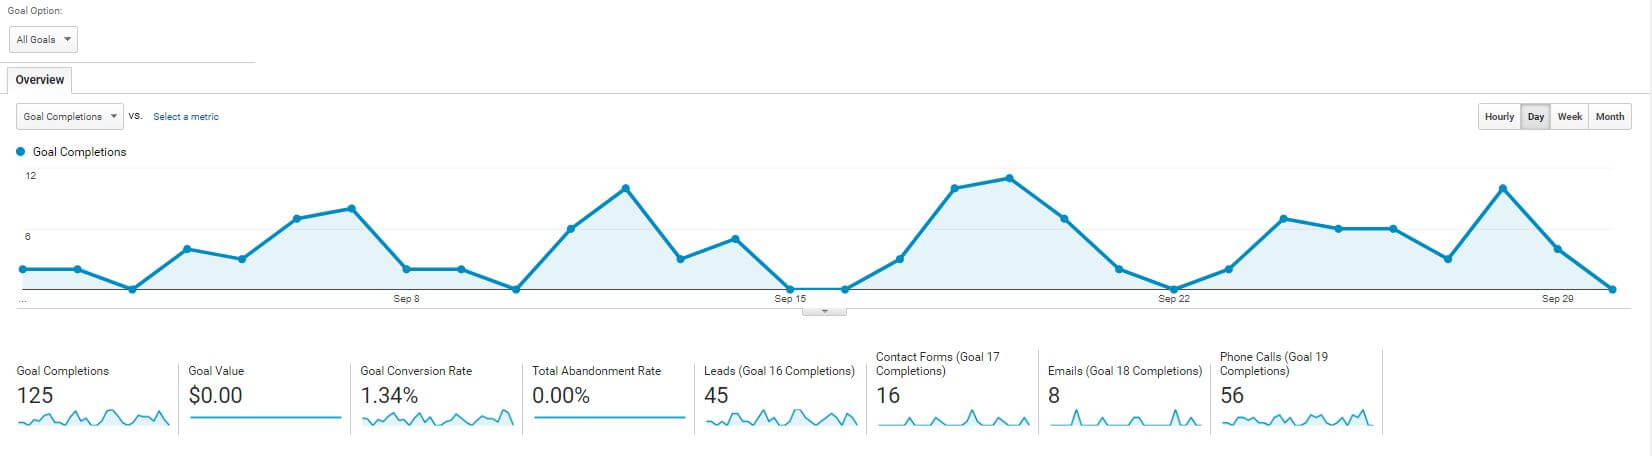
Here’s what you’ll find in this report:
Goal Completions - The total number of goals completed during a given time period. For this metric to be meaningful, you need to make sure all of your goals are meaningful. If you’ve set a goal for visits with more than one pageview, then you probably won’t use Goal Completions as an overall indicator of how well your business is doing online.
Goal Value - This is an optional metric that’s calculated based on the value you’ve assigned to each goal. More often than not, this will be $0 since it can be quite challenging to assign a goal value to a phone call or a contact form submission. However, if you’ve done the analysis to know exactly how much a form submission is worth based on your close rate and the lifetime value of a customer, then it’s worth your time to include that in your analytics.
Goal Conversion Rate - This combines all of your goal conversion rates together into one convenient number by dividing the total number of goal completions by the total number of sessions for that time period. Again, this is a terrible metric if you aren’t mindful of your goals. It would be very easy to inflate your total conversion rate by including ridiculous goals like "any user who looked at a page." However, you can also use this report to select one particular goal and then determine that conversion rate, which is much more useful. Knowing that 3% of your visitors submit your request a quote form is a lot more beneficial than knowing that 17% of your visitors did one of your goals.
Total Abandonment Rate - This number shows you the percentage of users who didn’t complete a goal based on a funnel you have set up. For example, maybe they entered the funnel by visiting your contact page, but they didn’t complete the form so they appear as an abandonment. This is a pretty underutilized metric and often appears as 0% because there may not be a clear funnel for your goals. For example, if one of your goals is phone calls, then literally every page could be a conversion point. How do you set up a funnel for that? The answer is, you don’t.
Any other metrics here will be based on the specific goals you have set up. You’ll be able to see the total number of each goal completed during the given time period. Additionally, you can also break down this report by Source / Medium to see where your goal completions came from, or you can look at the Goal Completion Location report to get a sense of where people are completing goals.
Again, if there’s nothing in this report, you need to set up some goals right away.
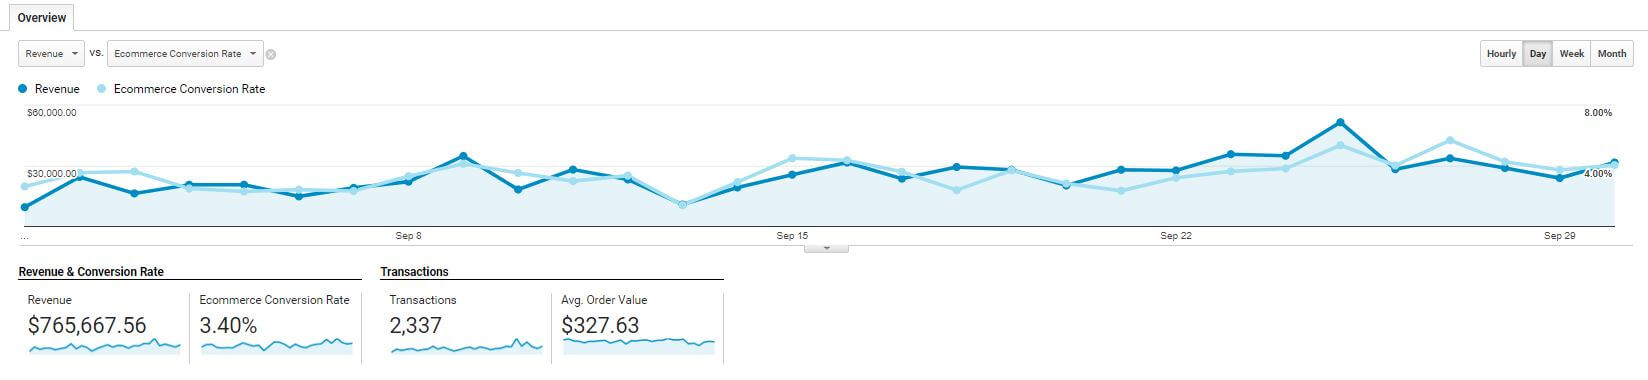
Now let’s move onto the Ecommerce Overview. If you sell things online, this report is an absolute must. Unfortunately, many website owners never configure this report either, so they don’t have any historical ecomm data and nothing to help them make better business decisions.
The ecommerce reports in Google Analytics contain a treasure trove of data that can help you improve your online business. We obviously can’t get into all of that here, but we can go through some of the basics:
Revenue - This is the total sales from the given time period. When we say total, we mean the total paid by all customers including tax and shipping. It probably won’t match up exactly with your total online revenue from your storefront because some users block analytics. But if the numbers are way off, then you may have a problem with your implementation.
Ecommerce Conversion Rate - The number of transactions divided by the number of sessions. An average ecommerce conversion rate is anywhere between 2 and 5% depending on what you sell and who your target market is. No matter what the number is, there are probably things you can do to raise the conversion rate. This might range from accepting more shipping options to improving your checkout process.
Transactions - The number of orders placed in the time period. As with revenue, it might not be the same as what you’re reporting directly from your website, but it should be close.
Avg. Order Value - Total revenue divided by the number of transactions. Pretty straightforward stuff.
The Ecommerce Overview includes a lot of other data such as the transactions and revenue from your marketing campaigns, your coupon codes, and your top sellers. Like I said, it’s a treasure trove, and we can’t possibly cover it all here. Just make sure you have it all enabled.
Spending all your time looking at analytics reports isn’t your job. As you can see from this post, even a basic understanding of analytics requires a lot. And this only scratches the surface of what analytics can tell you. That’s why you need to partner with a digital agency who knows their way around Google Analytics and can provide you with the actionable insights you need to improve your website and your campaigns.
Perrill is a full-service web design and development agency that also specializes in digital marketing, SEO, and more to ensure your website is operating at its full potential. Contact us today to make the most of your content and start converting users like never before.
Nate Tower is the President of Perrill and has over 12 years of marketing and sales experience. During his career in digital marketing, Nate has demonstrated exceptional skills in strategic planning, creative ideation and execution. Nate's academic background includes a B.A. with a double major in English Language and Literature, Secondary Education, and a minor in Creative Writing from Washington University. He further expanded his expertise by completing the MBA Essentials program at Carlson Executive Education, University of Minnesota.
Nate holds multiple certifications from HubSpot and Google including Sales Hub Enterprise Implementation, Google Analytics for Power Users and Google Analytics 4. His unique blend of creative and analytical skills positions him as a leader in both the marketing and creative worlds. This, coupled with his passion for learning and educating, lends him the ability to make the complex accessible and the perplexing clear.

